In the contemporary landscape of data-centric businesses, the ability to visually analyze and interpret data holds immense importance for making well-informed decisions. The ArcGIS Business Analyst Web App stands out as a comprehensive tool for mapping and location analysis, empowering businesses to collect and dissect demographic, economic, and consumer data to foster business development and expansion.
Generating maps within the ArcGIS Business Analyst Web App is a user-friendly process, allowing businesses to craft informative and visually captivating maps with just a few clicks. These personalized maps serve as powerful tools for visually illustrating trends or uncovering insights that might remain obscured when dealing solely with raw data. Moreover, the collaborative aspect of sharing these maps with team members or external entities enhances collective decision-making efforts.
WHAT THIS ARCGIS BUSINESS ANALYST WEB APP TUTORIAL COVERS
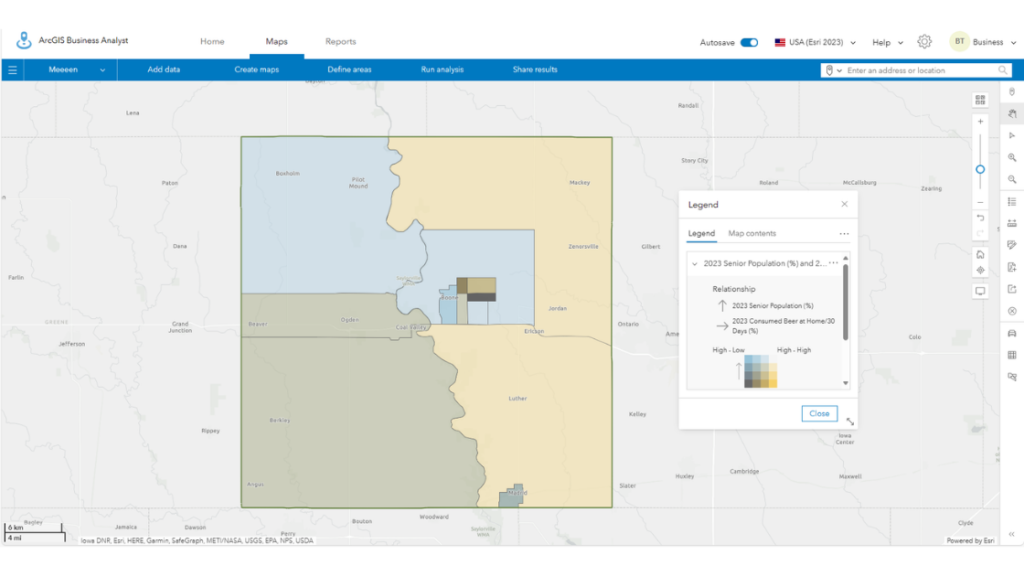
This tutorial delves into the process of creating a map within the ArcGIS Business Analyst Web App by initiating a new project. The project archive encapsulates all datasets used throughout the tutorial. Although these datasets typically encompass demographic, economic, and lifestyle data pertinent to businesses, this tutorial specifically employs data related to the senior population (65+ years %) and locations in Boone County, Iowa, exhibiting recent beer intake in homes (%). The GIS tutorial also explores map elements like layers, labels, and styles provided by the Business Analyst Web App.
CREATING STUDY AREAS IN ARCGIS BUSINESS ANALYST WEB APP
The ArcGIS Business Analyst Web App offers a 21-day free trial upon sign-up with an active business email. To register, visit the Free 21-Day Trial of ArcGIS Business Analyst sign-up page. Note that a business email account is requisite for the free trial period.
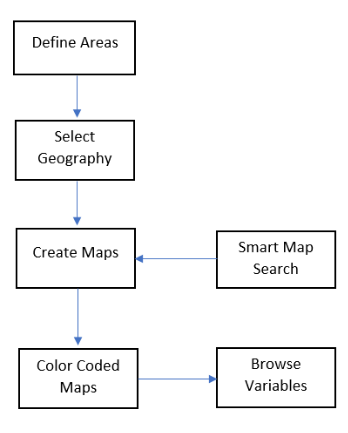
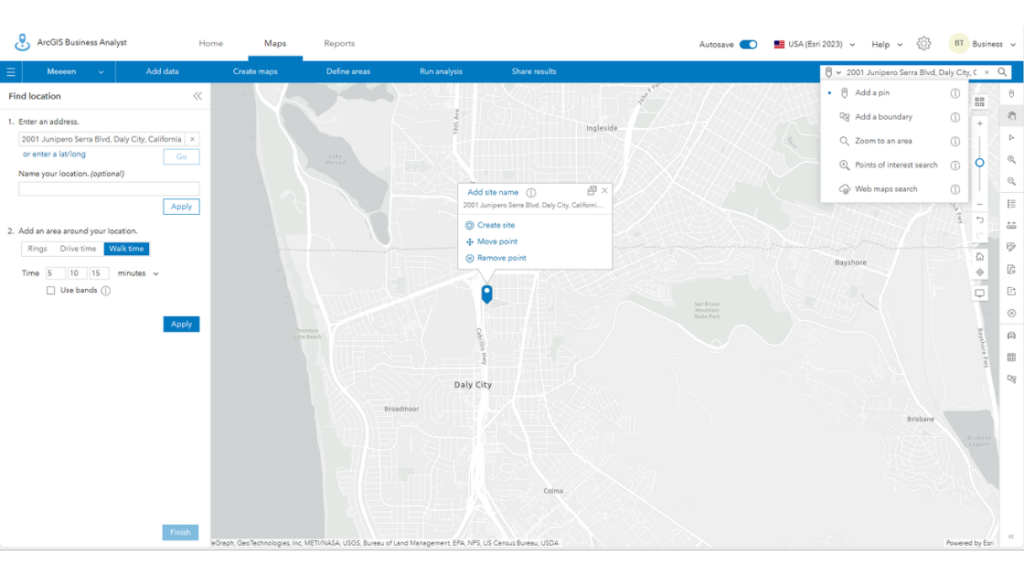
Following the sign-up process, log in using your username and password to launch the Web App. To establish a study area based on location for map creation:
- Initiate a new project by specifying a project name.
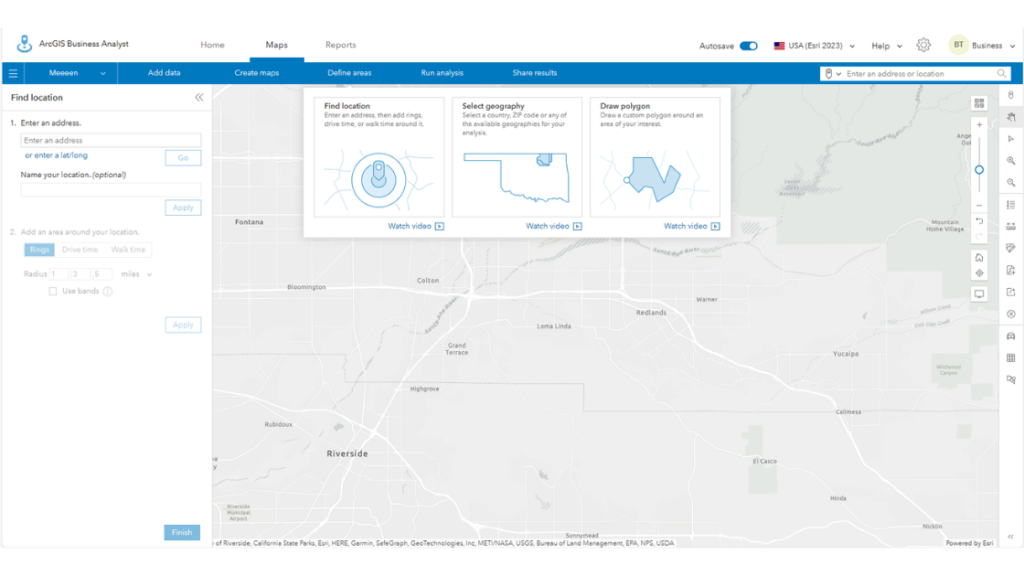
- Navigate to the maps tab and click on “Define Areas.”
- From the drop-down options, select “Find location.”
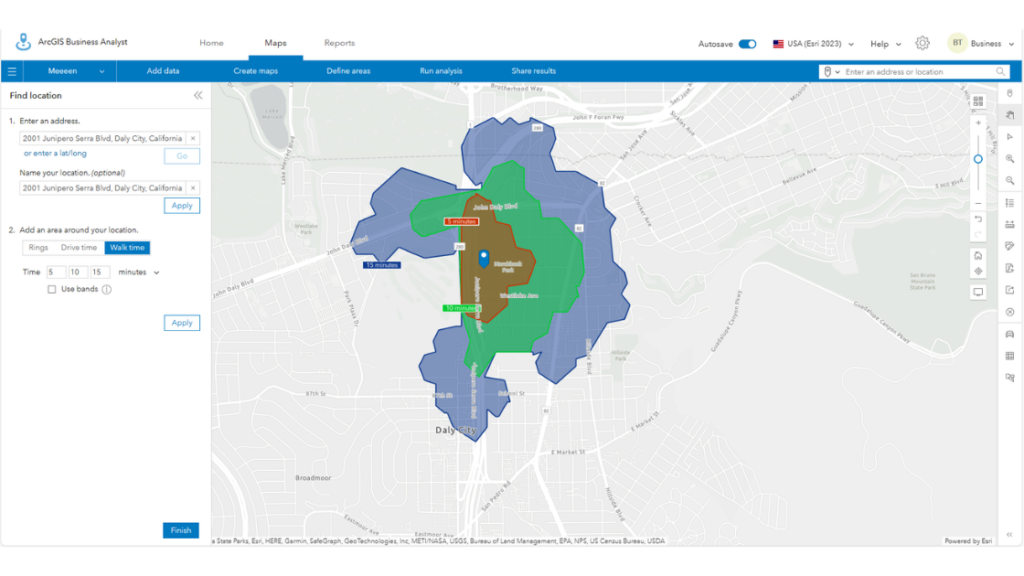
- Enter an address of interest or latitude/longitude for the location.
- In the “Name your location” space, provide a desired name for the location.
- The “Add an area around your location” option allows for creating Rings, Drive time, or Walk time around the address. For this tutorial, opt for “Walk Time” with 5, 10, and 15-minute rings.
- Click Apply.
It’s also feasible to define point locations of interest using the locations search bar, ensuring that the drop-down beside the search bar is set to “Add a pin.”
To set a study area in ArcGIS Business Analyst based on a polygon:
- Select “Define Areas” from the Maps tab.
- Choose “Select geography.” Options include searching for boundaries, selecting from the map, or picking from ESRI’s archive. Explore these options to understand how to define study areas as geographic boundaries.
In the United States, geographic boundaries may include the entire USA, states, counties, census tracts, ZIP codes, congressional districts, block groups, designated market areas, metropolitan areas, cities and towns, and county subdivisions.
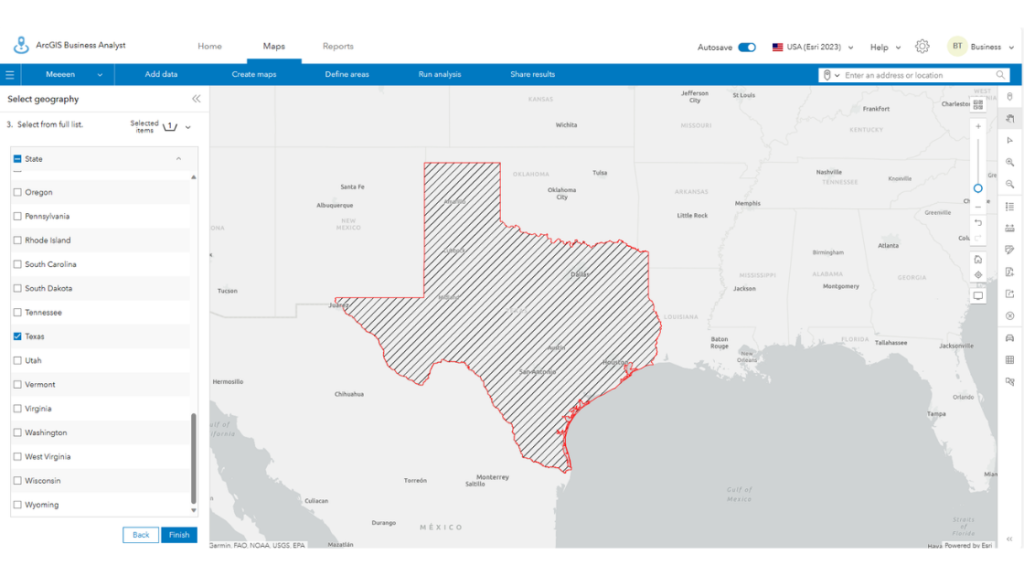
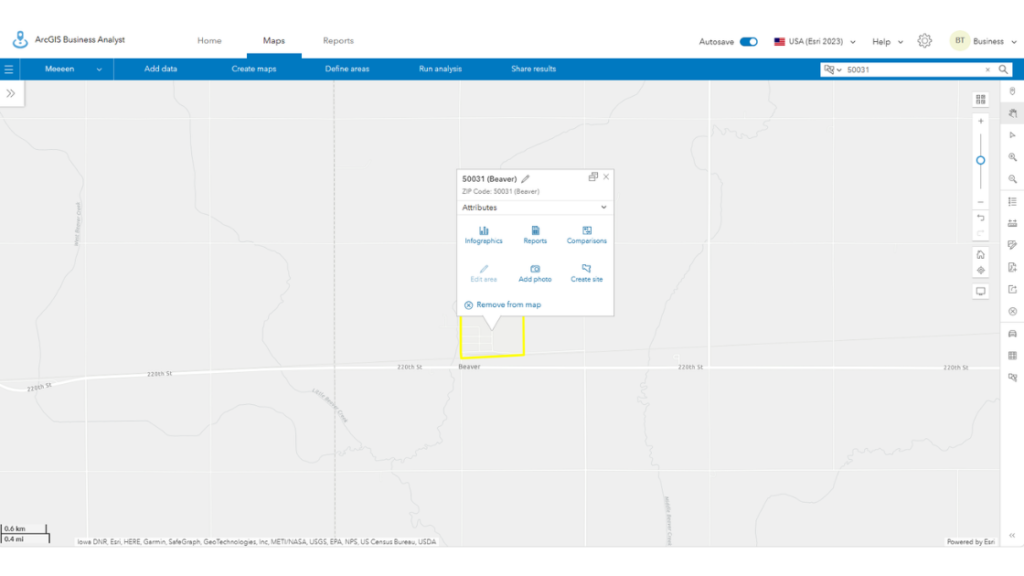
Alternatively, the locations search bar can define geographic boundaries. Ensure that the drop-down next to the search space is set to geographic boundary and specify the location’s name in the provided space.
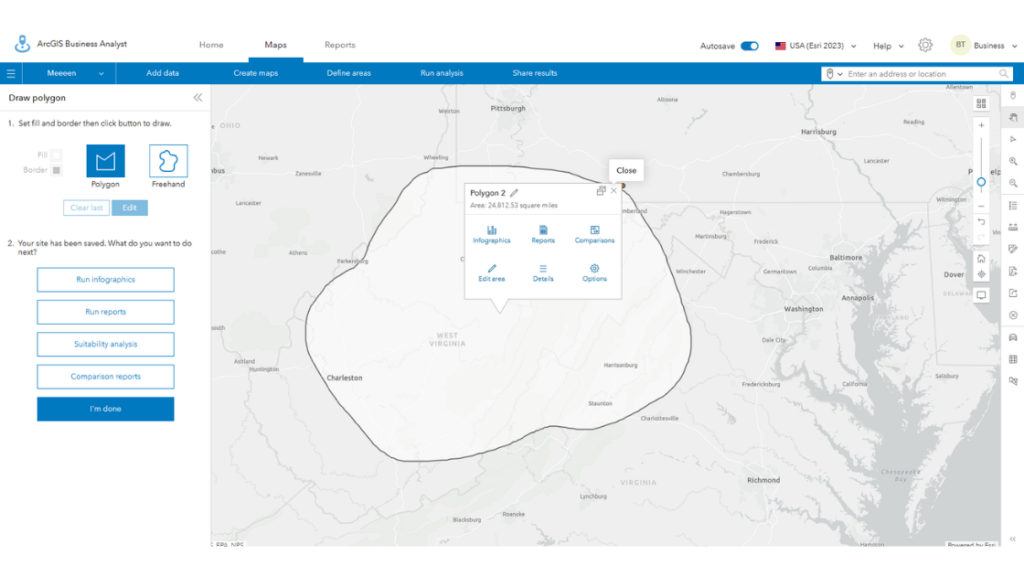
For custom areas, select the geographic area of interest by freehand digitizing:
- From the “Define Areas” tab (Maps), choose “Draw polygon.”
- Options are provided to digitize the boundary as a polygon or in a freehand sketch. Click on freehand.
- Toggle to the area of interest using the Web App map canvas.
- Use the red pointer on the screen to digitize the geographic boundary.
- Utilize “Fill and Border” options to define colors for the geographic boundary.
- Click “I’m done.”
USING ARCGIS BUSINESS ANALYST WEB APP TO ANALYZE AND MAP DATA
Utilize the Smart Map Search option to browse datasets:
Smart map search offers a platform for exploring data for map creation, allowing selection of a maximum of five variables. For this tutorial, we explore areas where the senior population (65 years plus) has consumed beer within the last 30 days at home in Boone County, Iowa. To use smart map search:
- Select “Create Maps” from the Maps tab.
- Choose Smart map search.
- Select “Browse all variables.”
- In the Data browser, type and search “senior.”
- From the options, select “2023 senior population (Age 65+) (Esri).”
- Choose Categories to return to the search bar of the Data browser.
- Type and search “drinking.”
- From the options, select “2023 consumed beer at home last 30 days.”
- Click Apply.

Use the “Guided Tour” option for new users to map the data:
The “Guided Tour” feature in ArcGIS Business Web App assists new users in navigating and exploring the Web App effortlessly. To create maps from variables, enable the guided tour option:
- From the profile drop-down, select “guided tours.”
- Choose “create a color-coded map from data.”

- Select “Create Maps” from the Maps tab.
- Choose “Classic color-coded maps.”
- Browse to select datasets as demonstrated in the smart map search.
- Select Bivariate from the style panel.
- Click Finish.