Earth observation through satellite imagery has revolutionized the way we study and understand our planet. By leveraging different band configurations, scientists and researchers can extract valuable information about vegetation, water bodies, urban areas, and geological features. Below, we explore the top 10 band configurations used in remote sensing, their applications, and how they help us uncover the hidden details of the Earth’s surface.
Natural Color (Red, Green, Blue)
The most intuitive and widely used band configuration is the Natural Color Composite, which combines the Red (R), Green (G), and Blue (B) bands. This configuration mimics what the human eye sees, providing a true-color visualization of the Earth’s surface.
- Application: General-purpose mapping, urban planning, and visual interpretation.
- Why it’s important: It serves as a baseline for understanding landscapes and is ideal for public communication and education.
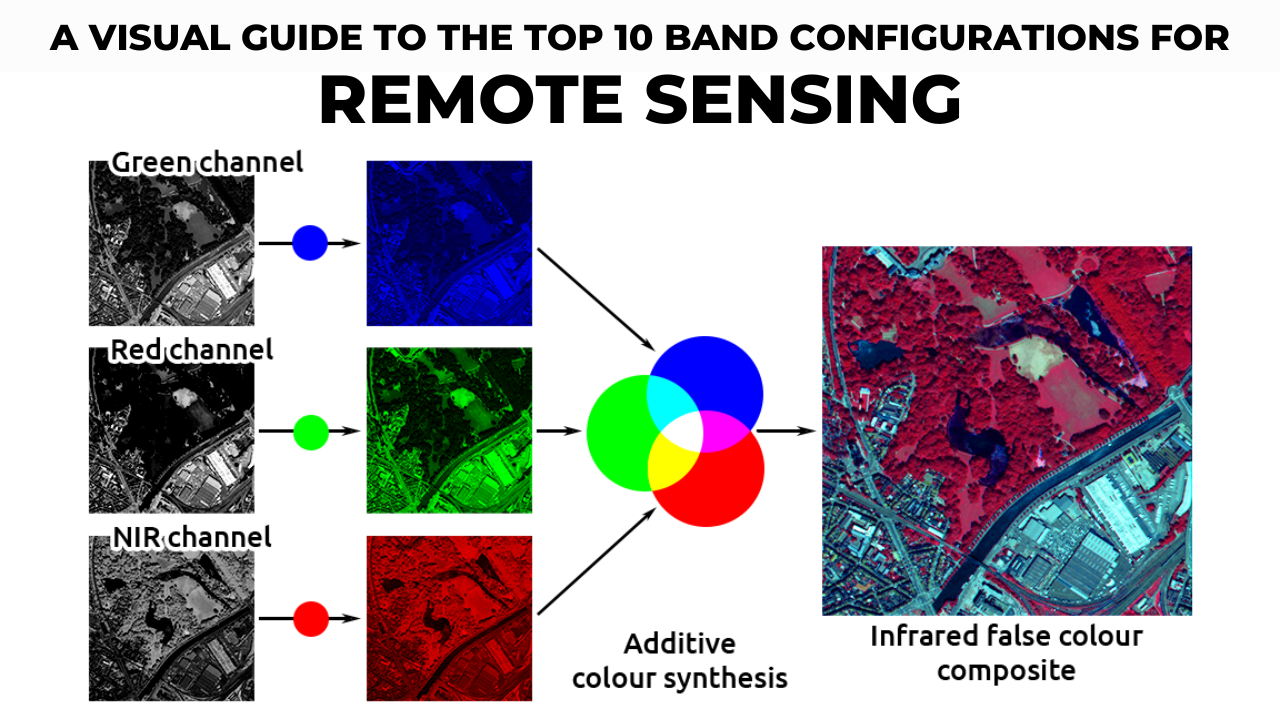
False Color (NIR, Red, Green)
Also known as the Color Infrared (CIR) composite, this configuration uses Near-Infrared (NIR), Red, and Green bands.
- Application: Vegetation analysis and urban-rural differentiation.
- Why it’s important: Healthy vegetation reflects strongly in the NIR band, making it appear bright red in the image. This helps in monitoring forests, crops, and land-use changes.
Shortwave Infrared (SWIR) Composite
The SWIR composite utilizes Shortwave Infrared bands (SWIR-1, SWIR-2) along with NIR.
- Application: Moisture content analysis and geological mapping.
- Why it’s important: SWIR bands are sensitive to water content in soil and vegetation, making them invaluable for drought assessment and mineral exploration.
Normalized Difference Vegetation Index (NDVI)
NDVI is a widely used index calculated using the NIR and Red bands.
- Formula: NDVI = (NIR – Red) / (NIR + Red)
- Application: Vegetation health and biomass estimation.
- Why it’s important: NDVI provides a quantitative measure of vegetation health, making it essential for agriculture, forestry, and climate studies.
Normalized Difference Water Index (NDWI)
NDWI uses the NIR and Green bands to highlight water bodies.
- Formula: NDWI = (NIR – Green) / (NIR + Green)
- Application: Water body delineation and wetland mapping.
- Why it’s important: NDWI is crucial for monitoring freshwater resources, flood assessment, and wetland conservation.
Thermal Infrared (TIR) Composite
This configuration combines Thermal Infrared (TIR), SWIR, and NIR bands.
- Application: Surface temperature analysis and urban heat island studies.
- Why it’s important: TIR bands measure heat emissions, helping to study climate change, energy consumption, and thermal pollution.
Shortwave Infrared False Color Composite (SWIR, NIR, Red)
This composite uses SWIR, NIR, and Red bands to create a false-color image.
- Application: Land/water differentiation and drought monitoring.
- Why it’s important: As seen in the featured image of the Lena River in Siberia, healthy vegetation appears bright green, while soils take on a mauve hue. This configuration is particularly useful for environmental monitoring.
Agricultural Monitoring (RE, NIR, Green)
The Red Edge (RE), NIR, and Green bands are used for precision agriculture.
- Application: Crop health monitoring and precision agriculture.
- Why it’s important: The Red Edge band is highly sensitive to chlorophyll content, enabling early detection of crop stress and optimizing agricultural practices.
Geological (SWIR, Red, Blue)
This configuration combines SWIR, Red, and Blue bands for geological studies.
- Application: Mineral exploration and lithological discrimination.
- Why it’s important: SWIR bands help identify specific minerals based on their spectral signatures, aiding in resource exploration.
Coastal and Aerosol Studies (Coastal Blue, Blue, Green)
This configuration uses Coastal Blue, Blue, and Green bands.
- Application: Coastal water quality and atmospheric corrections.
- Why it’s important: Coastal Blue bands penetrate water surfaces, making them ideal for studying coastal ecosystems and monitoring pollution.
Conclusion
Each band configuration is designed to enhance specific features of the Earth’s surface based on the spectral reflectance characteristics of various materials. From monitoring vegetation health with NDVI to analyzing urban heat islands using TIR, these configurations provide powerful tools for understanding and managing our planet’s resources.
Whether it’s the vivid green of healthy vegetation in a false-color composite or the mauve tones of soil in a SWIR image, these band configurations unlock a world of information that is invisible to the naked eye. As technology advances, the applications of these configurations will continue to grow, helping us address global challenges such as climate change, food security, and natural resource management.
By harnessing the power of these top 10 band configurations, we can gain deeper insights into the Earth’s dynamics and work towards a more sustainable future.