Map symbols include icons, colors, lines, and visual elements that convey information about the physical world. These symbols help communicate details such as roads, rivers, and population density, making maps easier to read and understand.
Different Kinds of Symbols in GIS In GIS, map symbology is used to represent features on a map, categorized into points, lines, and polygons for vector symbols. Raster symbols utilize color ramps for continuous and discrete data. Additionally, 3D symbols provide depth and dimension to the map.
Examples of Map Symbols
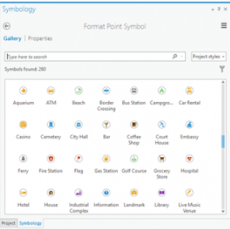
- Point Symbols:
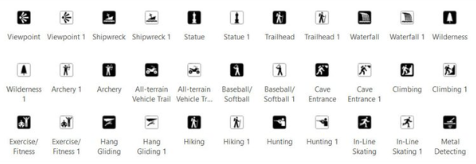
- Mark specific locations using distinct icons or markers.
- Example: The National Park Service (NPS) symbols indicate restrooms, campgrounds, and trails, aiding visitors in identifying park services.
- Line Symbols:

- Represent linear features like roads, rivers, and trails.
- Vary in style, width, and color to differentiate between different types of paths or boundaries.
- Polygon Symbols:
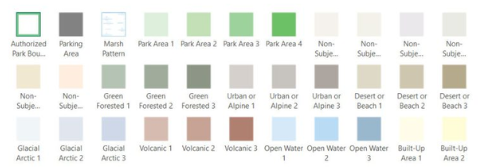
- Represent areas by enclosing them within shapes.
- Differentiate between various land and water features within national parks.
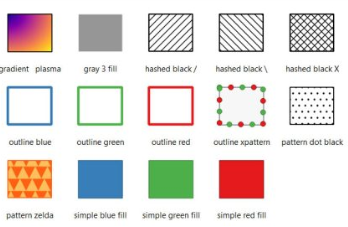
- Raster Fill Symbols:
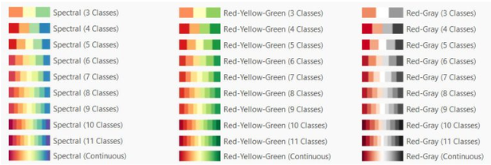
- Used for raster data, representing continuous or discrete changes across a surface.
- 3D Symbols:
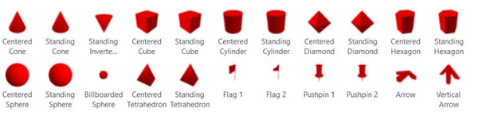
- Add depth and perspective to represent real-world features.
- Include geometric markers like cones, spheres, and cubes, as well as 3D models like buildings.
GIS Symbology Sources If you’re looking for map symbology, here are some sources to explore:

ColorBrewer:
Provides carefully chosen color schemes, including “colorblind safe,” “print-friendly,” and “photocopy safe” palettes.
ArcGIS Pro Styles:
Offers nearly 200 style files (STYLX) for download, covering various themes like transportation, public safety, and forestry.
QGIS Styles Repository:
An online collection of styles and symbols for QGIS, with over 160 options to choose from.
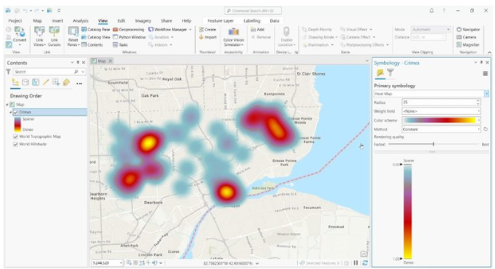
Changing Symbols in ArcGIS Pro and QGIS
- Easily change symbols in ArcGIS Pro by selecting and replacing them in the Table of Contents.
- Access additional style files through Esri ArcGIS Pro Styles page or QGIS Styles Repository to enhance your project.
Design and Understanding Through Symbology Map symbology involves using symbols and colors to represent real-world features, aiding people in quickly understanding the information on a map. For example, a blue line may represent a river, and a red line could signify a highway. By simplifying complex geography into colorful lines and shapes, map symbology ensures easy navigation, unless, of course, getting lost is part of the adventure!