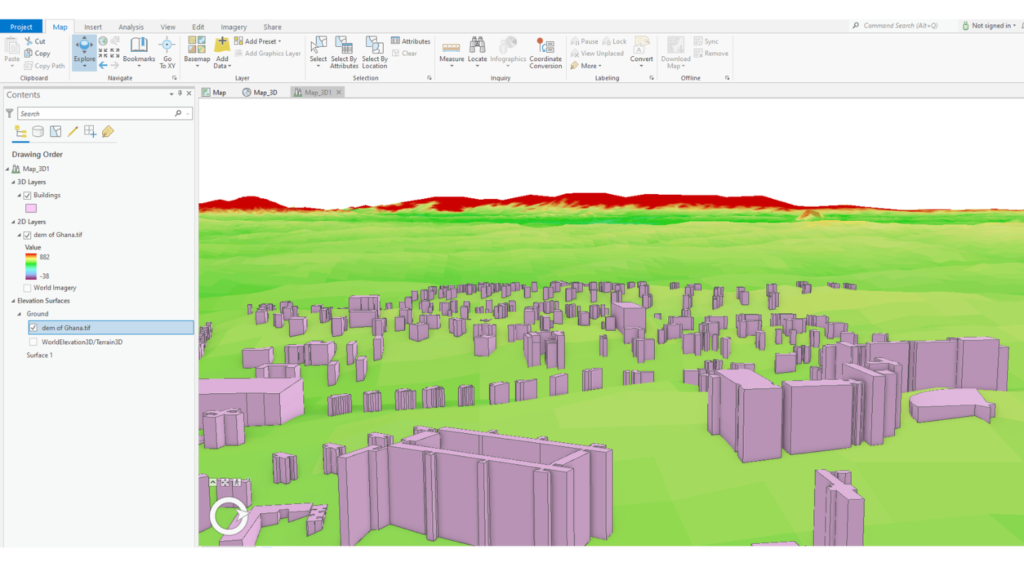
ArcGIS Pro is a mapping software offering an incredible array of tools for creating visually appealing maps that meet everyday needs. One feature of ArcGIS Pro is the ability to develop 2.5D maps through the global and local scenes, allowing you to represent elevation data in your maps in a visually stunningly way.
What is a 2.5D map?
A 2.5D map displays a three-dimensional landscape representation on a two-dimensional plane. It will enable you to introduce elevation data in a way that is visually engaging and contextually relevant.
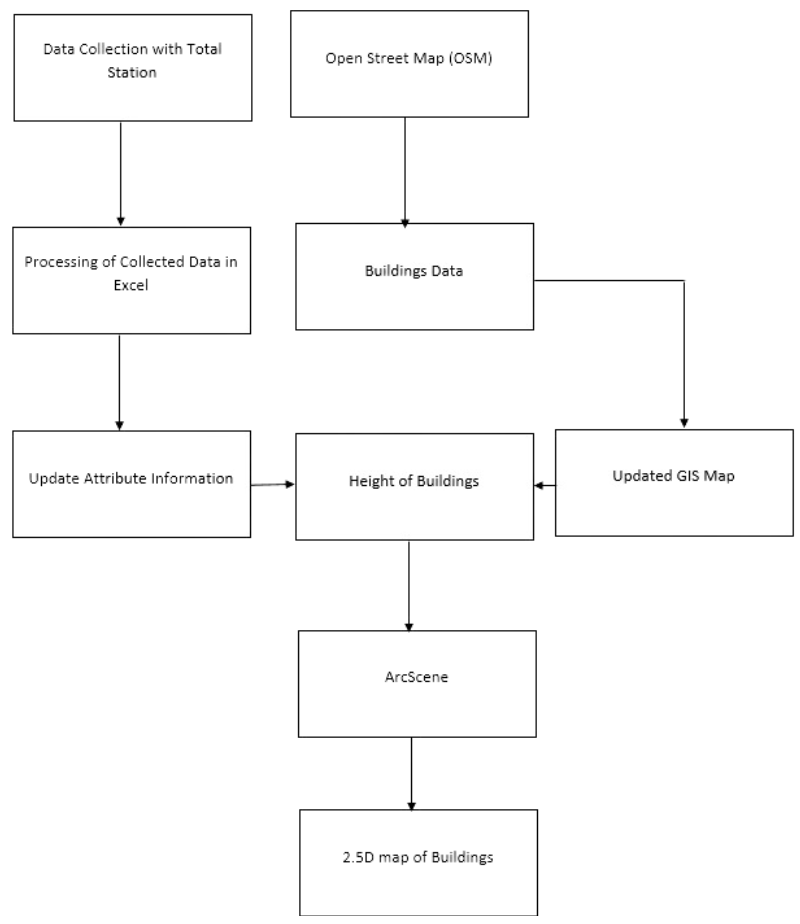
Learn to create 2.5D maps in GIS with OpenStreetMap data
This tutorial adds to the many urban landscape visualization techniques by providing a systematic approach to creating a 2.5D map of buildings in ArcGIS Pro to understand the built environment better. Learn how to retrieve data from OpenStreetMap and convert the data from OSM format into shapefile format.
How to extract building data from OpenStreetMap
To extract building footprint data from OSM,
- Open OSM’s website.
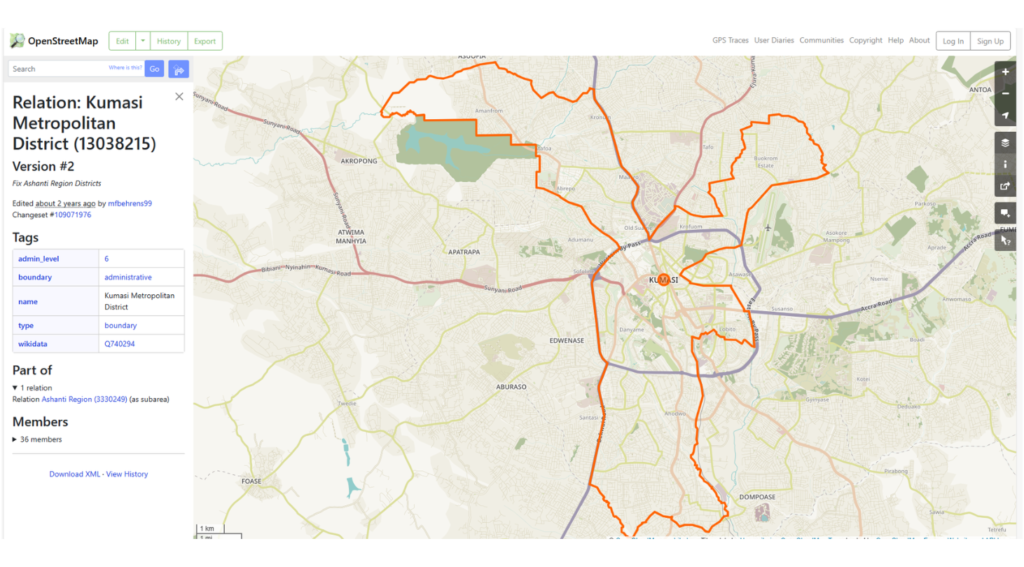
- From the web interface, type your desired area of focus from the search bar. For this tutorial, “Kumasi (in Ghana)” is used.
- Select “Export” from the search results.
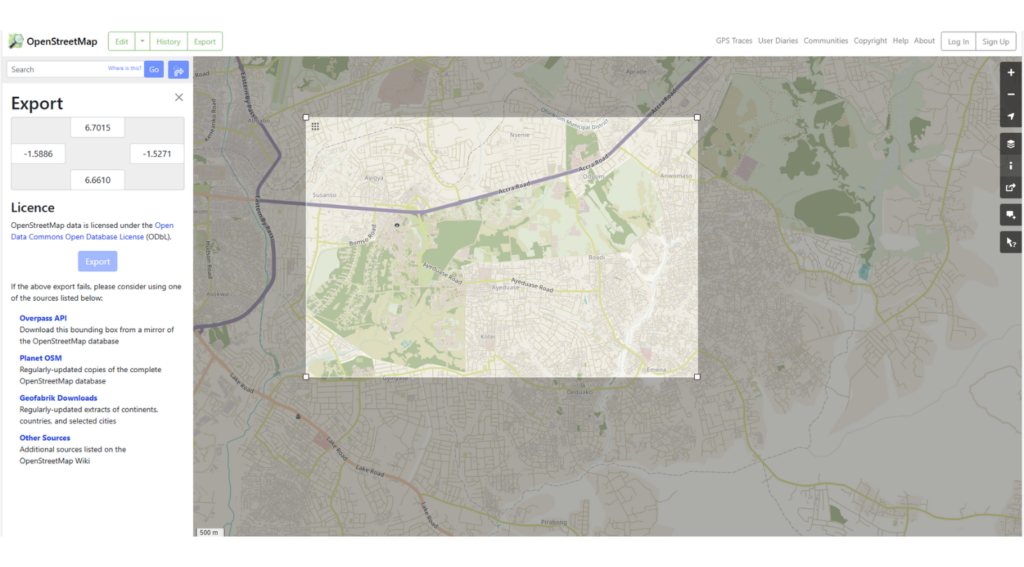
- Use “manually select a different area” option to further limit the area of focus to Kwame Nkrumah University of Science and Technology (KNUST) area.
- Click Export.
The exported file comes in an OSM file format. To be able to open this file in ArcGIS Pro, we need to convert the OSM format into a shapefile. To do this we are going to use QGIS, an open source GIS software program that can be freely accessed.
- Launch QGIS and select “New Project.” QGIS is a free desktop GIS software.
- From the menu bar, select “Layer.”
- Select “Add layer.”
- Select “Add vector layer.”
- Set “Vector database” to the downloaded OSM file.
- Select “Add.”
- From the pop-up window that occurs, select “Add layers.”
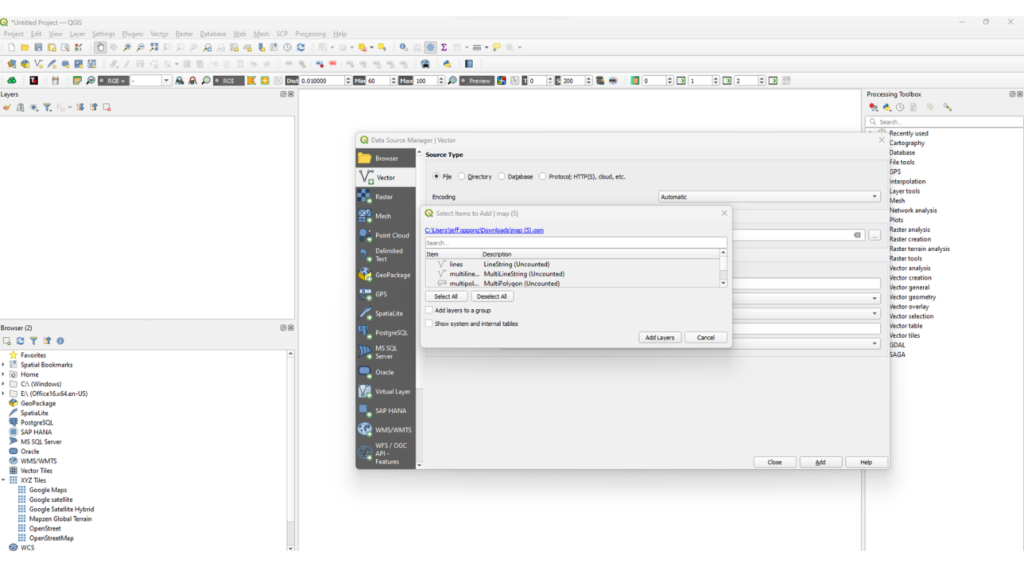
For this tutorial, we are concentrating on buildings as the vector layer of focus. As a result, the other layers representing lines (roads) and points are deleted.
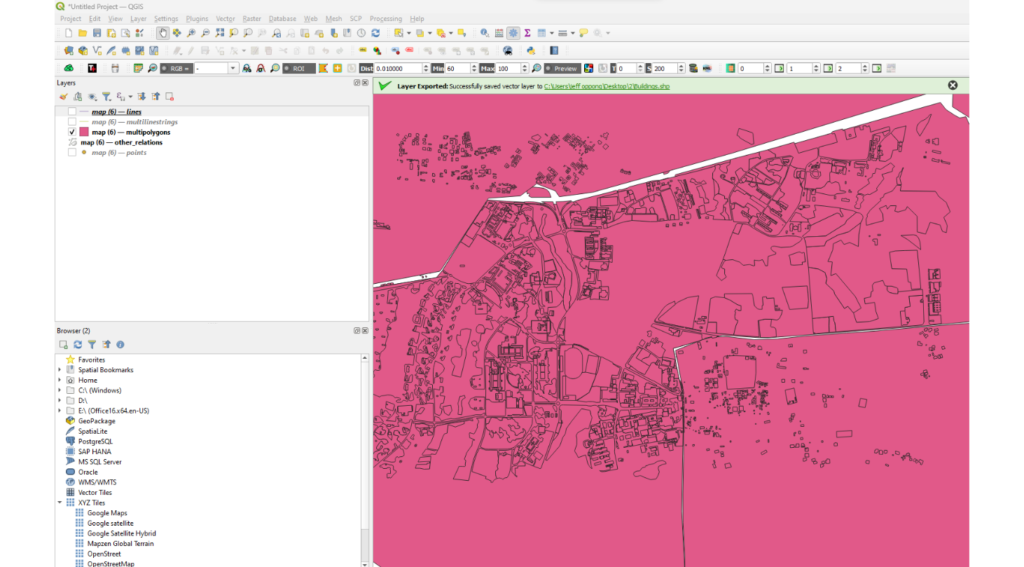
Edits are made on the attribute table to ensure that other polygon layers that represent forest, wood, parks, sports pitch, and health land are removed. For more information on how to edit the attribute table in QGIS, use the link attached (Editing Attribute Table in QGIS – YouTube).
- After edits, right-click on the polygon layer.
- Select “export.”
- Select “export features as” and choose the shapefile format option
- From the pop-up window, set “File name” to desired output name and location.
- Select Ok.
Importing data into ArcGIS Pro and creating scenes
To import data into ArcGIS Pro and create global and local scenes:
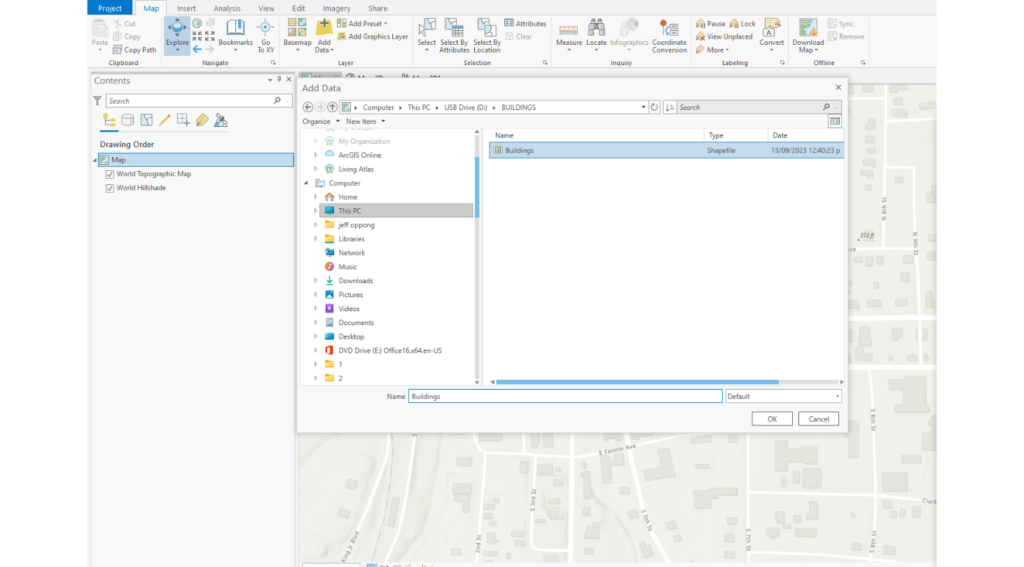
- Open and create a new project in ArcGIS Pro.
- Select “Add data” from the Map tab of the menu bar.
- Toggle to the location of the saved (exported) buildings shapefile.
- Click Ok.
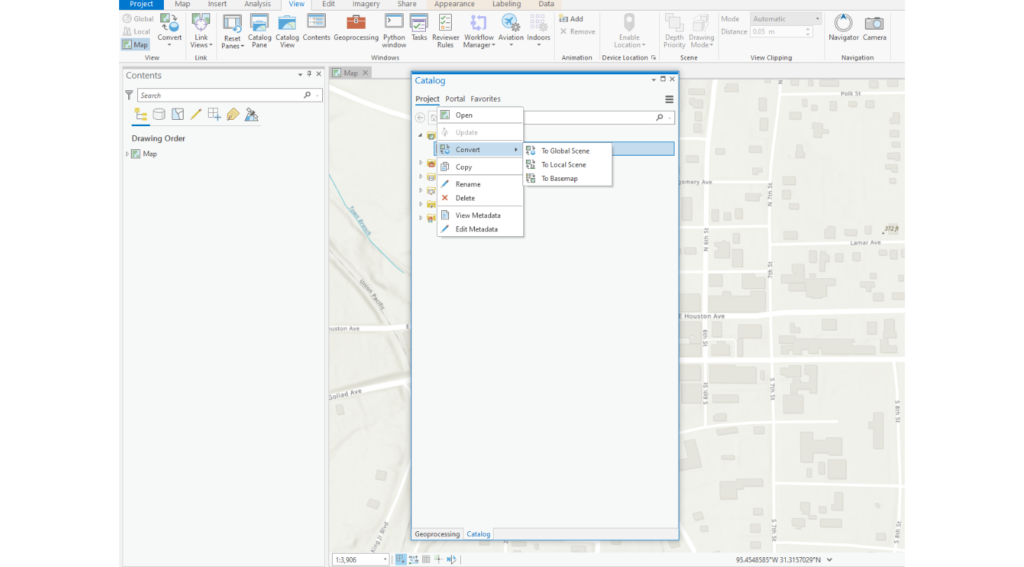
- Select the “Catalog pane” from the view tab.
- Right-click on map under the “Maps” tab.
- Select “convert.”
- Select “To global scene.”
Use vertical exaggeration in ArcGIS Pro to visualize topography
To visualize the topography of the area, we can use the vertical exaggeration option:
- Click on “Ground” under the Elevation Surfaces tab.
- Set “Vertical exaggeration” to 3.
- To better visualize the area, select “Imagery” from the base map options of the Map tab.
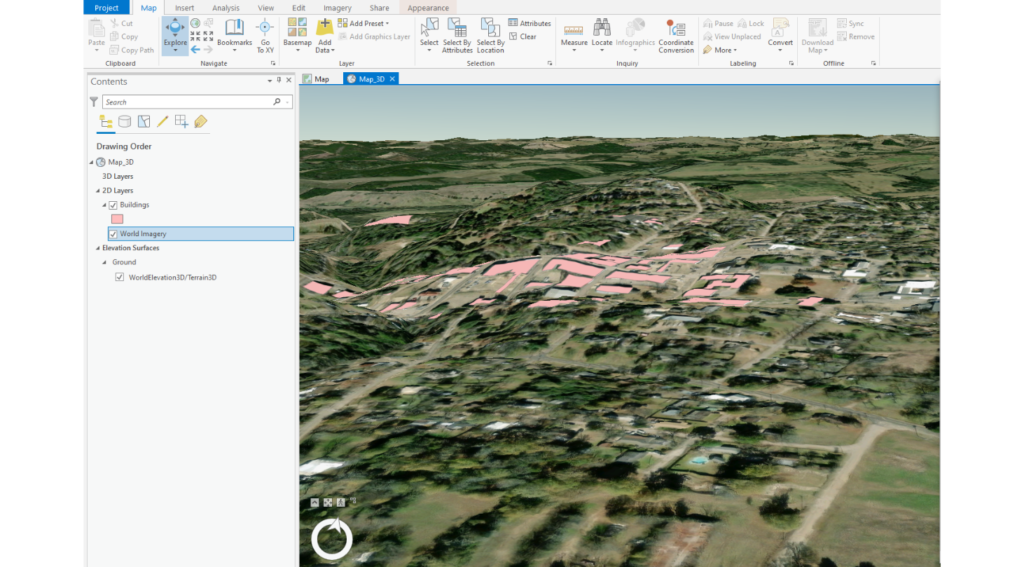
Use local scenes to represent a smaller geographic region or neighborhood
Local scenes are normally localized, large scale, and represents a neighborhood or city.
To convert 2D maps to local scenes:
- Right-click on “Map” from the Maps tab of the Catalog pane.
- Select “Convert.”
- Select “To local scene.”
- Click on “Ground” under the Elevation Surfaces tab.
- Set “Vertical exaggeration” to 3.
- To better visualize the area, select “Imagery hybrid” from the base map options of the Map tab.
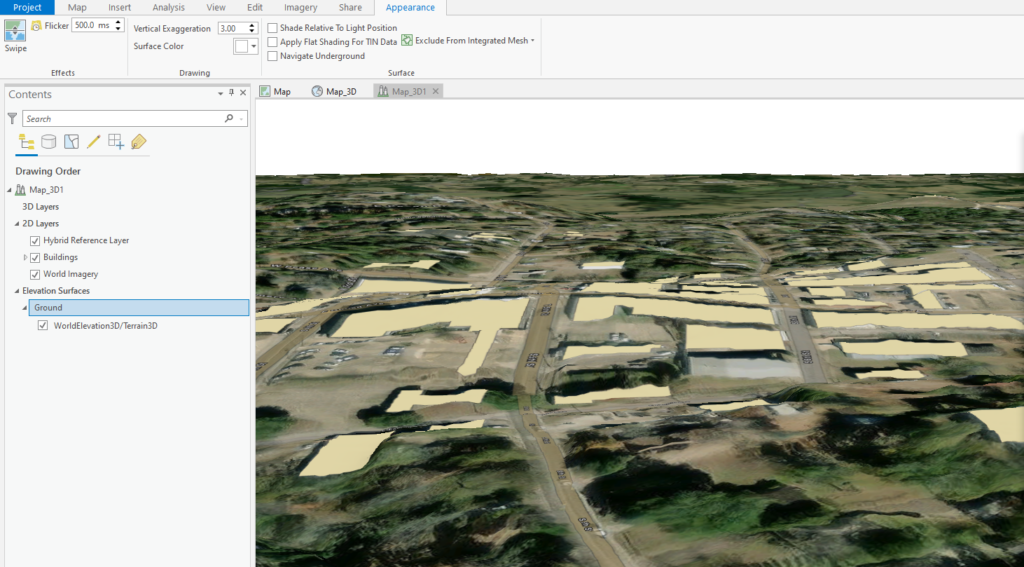
Extruding building heights to create a 2.5D map
Extrusion in ArcGIS Pro is done by the height of buildings. This helps to visualize the buildings in 2.5D.
Data on height of buildings can be collected on sites by conventional survey techniques (Land Surveying) and the total station instrument. For more information on using the total station to collect building height data, check out this material from the University of South Alabama.
To extrude the buildings:
- Click on Buildings from the Table of Contents.
- Select Appearance from the menu bar.
- From the extrusion menu, set “Type” to max height.
- Set “field” to heights.
A Digital Elevation Model (DEM) can be imported to serve as a basemap. To do this:
- Right-click on “Ground” from the elevation surfaces tab (Table of contents).
- Select “Add elevation source.”
- Toggle to the location of the DEM. DEM can be retrieved from United States Geological Survey (USGS)’s website after a free sign up.
- Click Ok.
