
Migrate from ArcMap to ArcGIS Pro
ArcGIS Desktop is in its final support phase and will be retired on March 1, 2026. There won’t be any new versions of ArcGIS Desktop. It’s recommended that you switch to ArcGIS Pro. For more details, check out “Migrate from ArcMap to ArcGIS Pro.
One of the most basic questions asked of a GIS (Geographic Information System) is “What’s on top of what?” For example:
- What kind of land use is on top of which soil type?
- What parcels of land are within the 100-year floodplain? (“Within” means “on top of.”)
- What roads are within what counties?
- What wells are within abandoned military bases?
Before GIS, cartographers would make maps on clear plastic sheets and layer them on a light table to see how different data overlapped. Because overlaying data gives such valuable information, it was crucial for the development of GIS.
An overlay operation is more than just combining lines; it carries all the attributes of the features involved. For example, when parcels (areas of land) and flood zones are overlaid (using the Union tool), a new dataset is created. Parcels are divided where they cross flood zone boundaries, creating new polygons. The FID_flood value shows if polygons are outside (-1) or inside the flood zone, and all polygons keep their original land-use category values.

You can figure out the total area of each land-use type in the flood zone by selecting all polygons within the flood zone (using the Select Layer By Attribute tool) and then summarizing the area by land-use type (using the Frequency tool). Here’s a chart showing the results.

In a similar way, you could overlay watershed boundaries with a vegetation layer to find out how much of each vegetation type is in each watershed.
In the picture below, logging roads (lines) and vegetation types (polygons) are overlaid to make a new line feature class. The lines have been split where they cross the polygons, and each line feature now has the attributes from both original layers. The lines are shown with symbols representing the vegetation type they are associated with.

You can use overlay analysis to combine the features of several datasets into one. This helps you find specific places that meet certain criteria. For example, overlay analysis is often used to find suitable locations for a specific purpose or to identify areas at risk. To do this, you might overlay layers like vegetation type, slope, aspect, and soil moisture to find areas prone to wildfire.
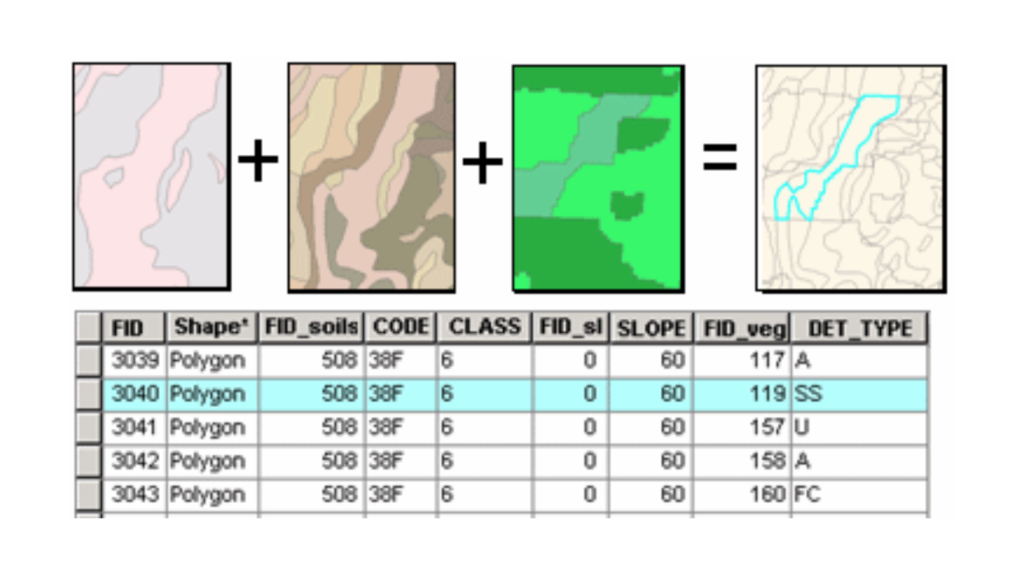
Below is an example of overlaying steep slopes, soils, and vegetation. New shapes are created where the original shapes overlap. These new shapes have all the information from the original shapes.
Overlay analysis is often used with other types of analysis. For example, you might include data from proximity analysis (like using the Buffer tool) or surface analysis (using the Slope or Aspect tools). After the overlay, you might do more analysis, like selecting a subset of features or combining polygons. Overlay is usually one step in a larger analysis process or model and can happen at different points in that process.
Overlay Methods
There are two main ways to do overlay analysis: feature overlay and raster overlay. Feature overlay involves points, lines, or polygons, while raster overlay uses grid cells. Depending on what you need to do, one method might be better than the other. For example, if you need to find places that meet certain criteria, raster overlay might be easier, but you can also use feature data. It also depends on how your data is stored. Sometimes, it might be useful to change your data from one type to the other to make the analysis easier.
Feature Overlay
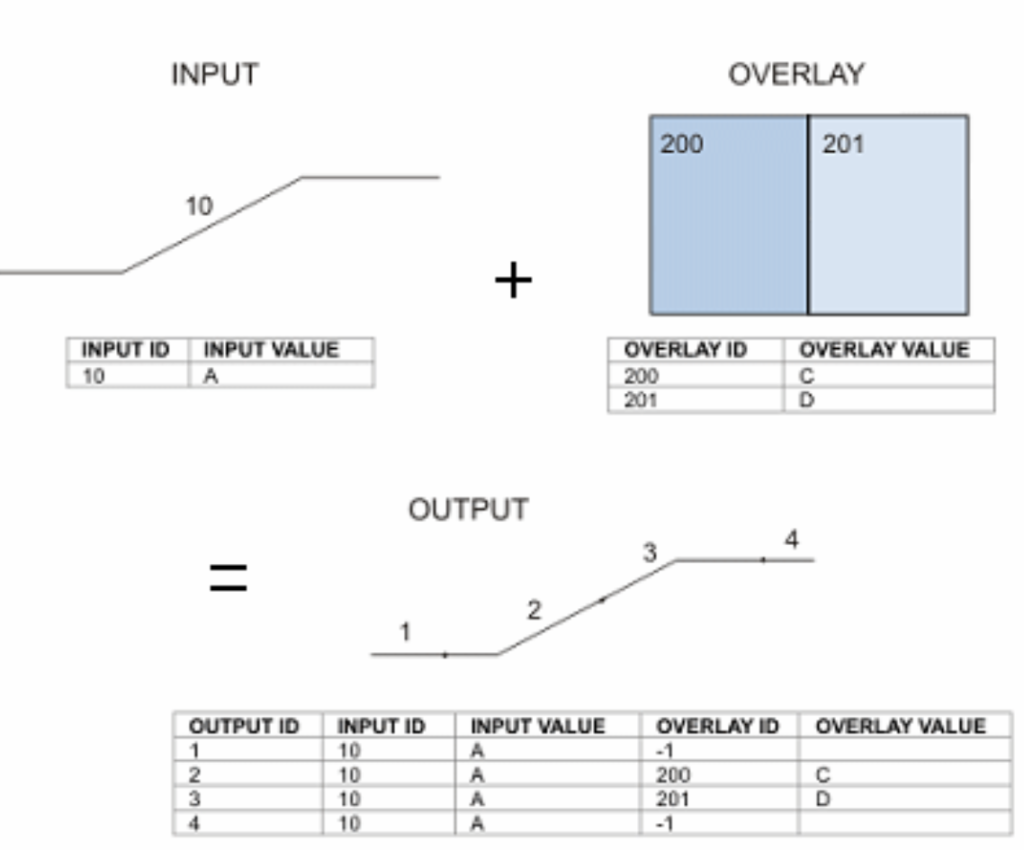
Feature overlay involves three main parts: the input layer, the overlay layer, and the output layer. When you do a feature overlay, the input layer gets split where it overlaps with the overlay layer. This creates new areas where polygons intersect. If the input layer has lines, they get split where polygons cross them. These new pieces are saved in the output layer, and the original input layer stays the same. The new features in the output layer have the attributes from both the input and overlay layers.
Here’s an example of putting a line on top of a shape. The line gets cut where it crosses the shape’s edges, and each piece of the line keeps its original information plus the information from the shape it ends up in.
Raster overlay
In raster overlay, each square (or cell) in every layer matches the same spot on a map. This makes it easy to combine different pieces of information from many layers into one layer. Usually, we give each piece of information a number so we can add them up and give a new number to each square in the final layer.
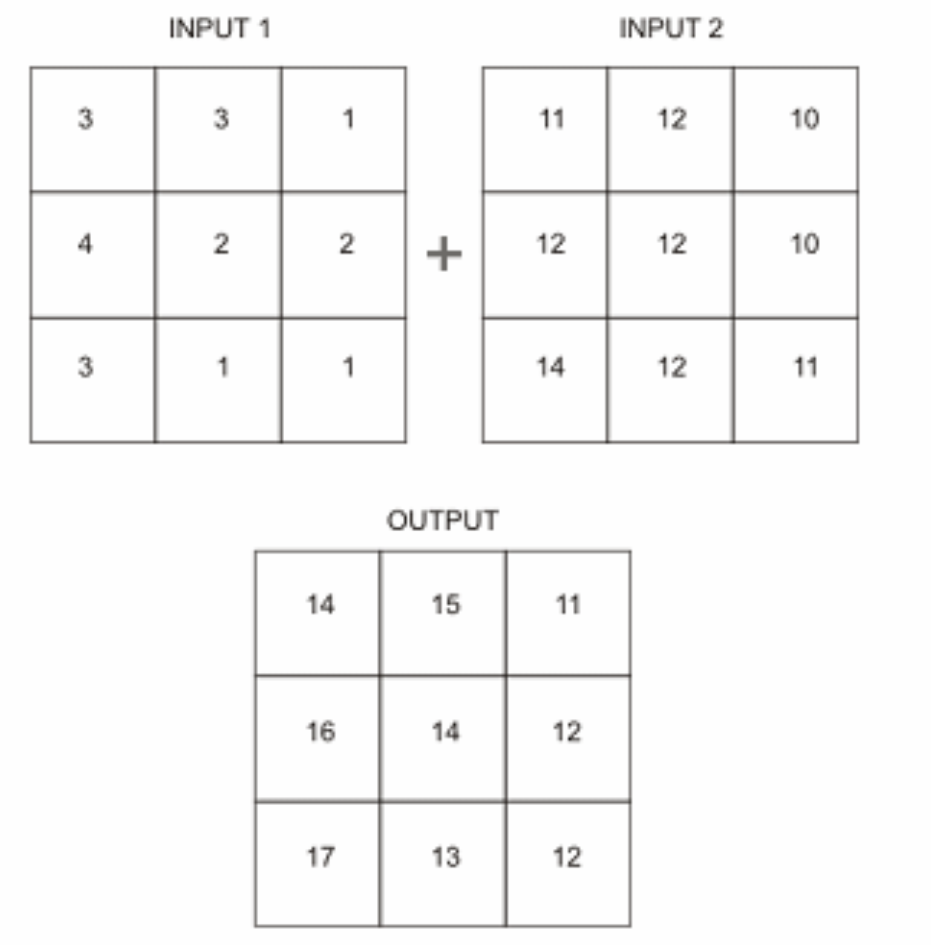
Here’s an example of raster overlay by addition. Two input layers are added together to make a new layer where the numbers in each square are the sum of the numbers from the two input layers.
This method is often used to rank how suitable or risky something is by giving each piece of information a score, then adding the scores to get an overall rank for each square. Different layers can also be given different levels of importance by multiplying their scores by a weight value before adding them together.
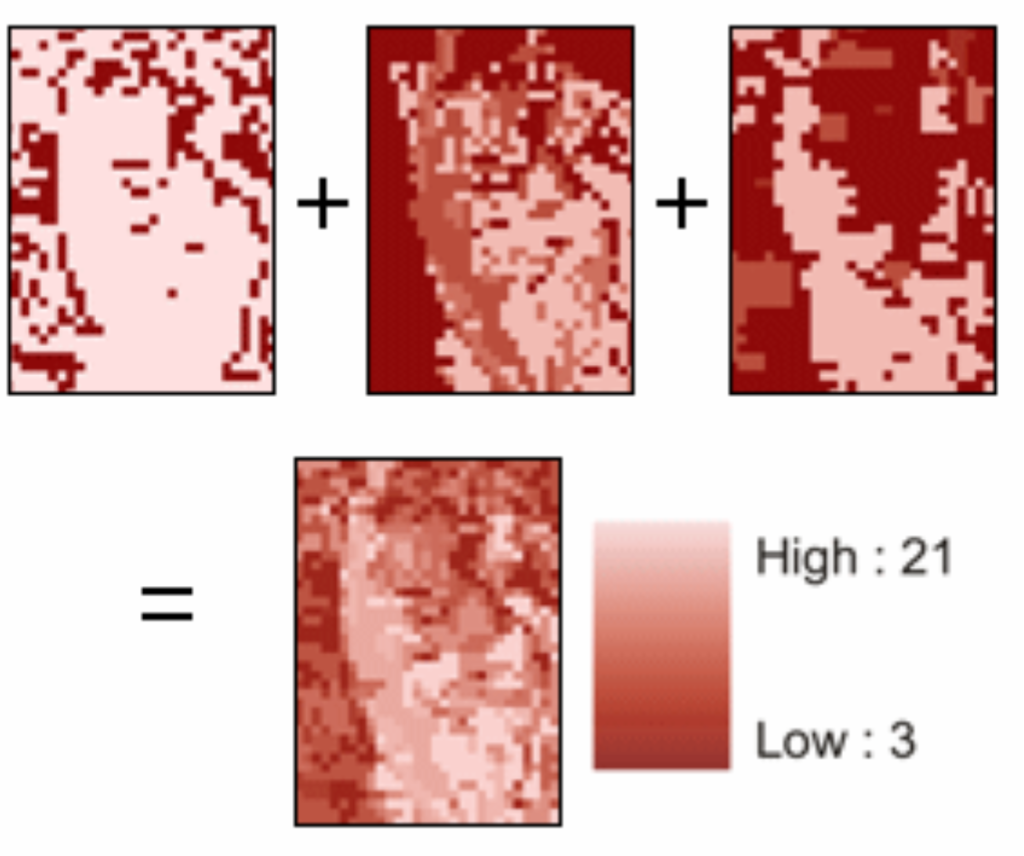
Here’s an example of raster overlay by addition for figuring out suitability. Three layers (steep slopes, soils, and vegetation) are scored for how good they are for development on a scale from 1 to 7. When the layers are added together (bottom), each square gets a score from 3 to 21.
Alternatively, you can give each square in the final layer a value based on unique combinations of values from several input layers.
Overlay tools
Vector overlay tools
Feature overlay tools can be found in the Analysis toolbox under the Overlay toolset. The tools work in similar ways but differ in what types of features they let you overlay, whether you can overlay multiple layers at once, and which input and overlay features are kept in the final layer.
The table below shows what happens when you use each tool to combine an input dataset with an overlay dataset.

Raster overlay tools
Raster overlay tools can be found in several sections of the Spatial Analyst toolbox. Spatial Analyst is an extra add-on for ArcGIS that you need a special license to use. If your site has a Spatial Analyst license and the extension is installed, you can access the Spatial Analyst toolbox in ArcToolbox.