Radar bands are like teams of special waves. Each team can go through the ground in its own special way and show us different things about the world.
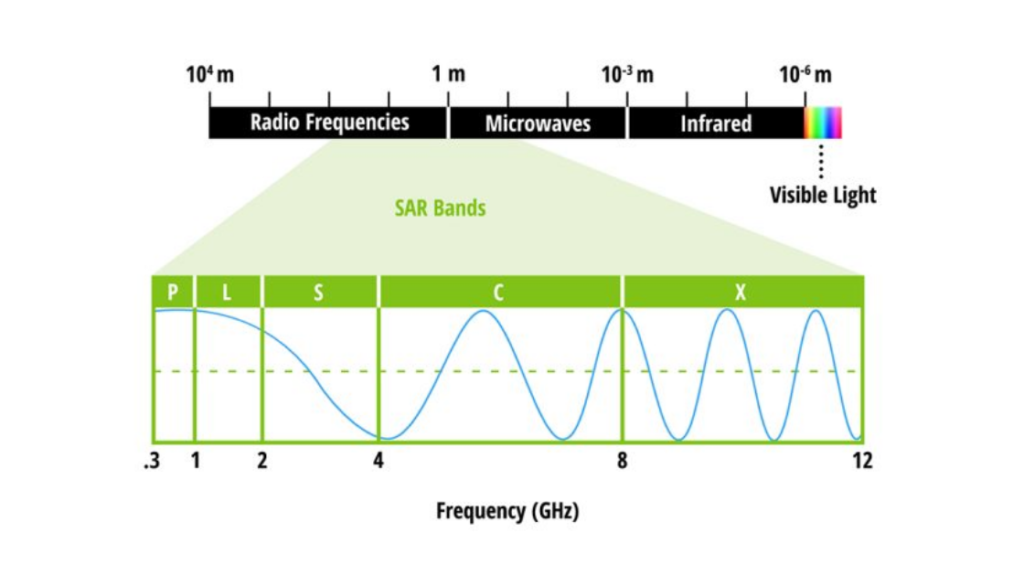
These radar bands have their own special frequencies, kind of like how different colors have their own special spots in the rainbow. We call them by letters like L-, S-, C-, and X-band. We’ll learn more about them later on!
What is Synthetic Aperture Radar?
Synthetic Aperture Radar (SAR) is a fancy kind of radar that takes pictures of the Earth. Instead of staying still like regular radars, SAR moves around while it takes pictures. This makes it seem like it has a big camera, giving us really clear images of the ground.
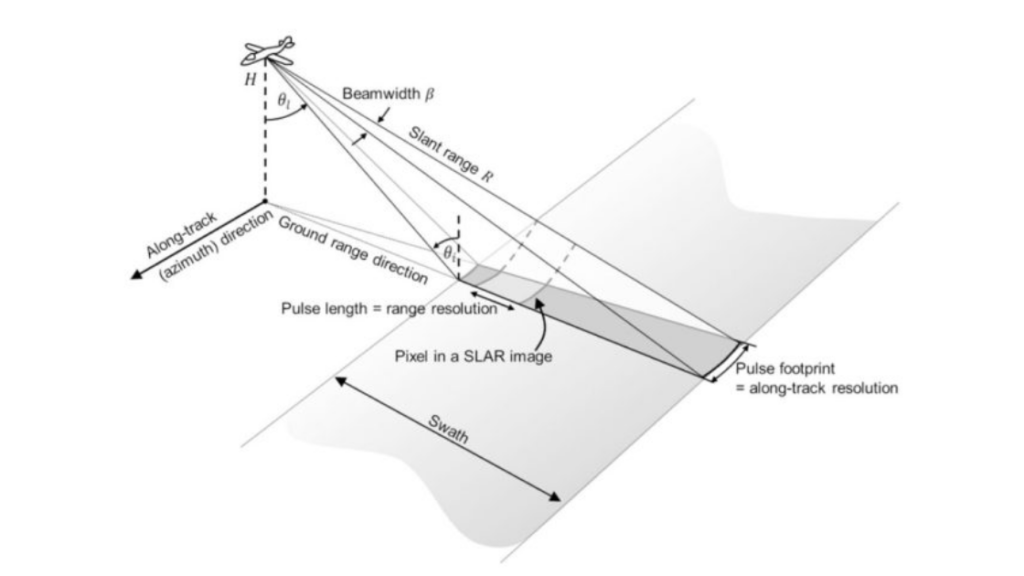
Whether it’s up in the air or out in space, radar imaging sends out a special kind of microwave pulse sideways. Then, it checks out the reflections from things on land, like tree branches, buildings, or the ground itself.
We’ve put together this helpful guide about SAR, complete with examples. It’s a great place to begin if you want to learn more about the topic. One important thing to know is that SAR is like an active detective, always on the lookout. Plus, it can do its job no matter what the weather is like or even when it’s nighttime.
Exploring Radar Bands in Synthetic Aperture Radar
Understanding how radar bands and SAR work together is really important. That’s because the type of radar band we choose decides how well SAR can see through things. That’s why certain radar bands are used more often for different jobs.
| Band | Frequency | Wavelength | Applications and Use Cases |
|---|---|---|---|
| X | 8 – 12 GHz | 3.8 – 2.4 cm | Urban monitoring, ice and snow, weather monitoring, limited penetration into vegetation cover |
| C | 4 – 8 GHz | 7.5 – 3.8 cm | Land use, agricultural monitoring, deforestation, ice monitoring, ocean and maritime navigation |
| S | 2 – 4 GHz | 15 – 7.5 cm | Biomass measurement, forestry management, soil moisture assessment, geology, and hydrology studies |
| L | 1 – 2 GHz | 30 – 15 cm | Soil moisture detection, glacier monitoring, geophysical assessment; biomass and vegetation mapping; interferometric SAR (inSAR) |
| P | 0.3 – 1 GHz | 100 – 30 cm | Deep penetration capabilities for detecting landslides, erosion, archaeology, and wetland monitoring |
The Versatility of SAR with Radar Bands
SAR’s capability to utilize various radar bands makes it an extremely valuable tool for observing the Earth. For instance, certain bands are very good at seeing through dense forest canopies.
Choosing the right radar band involves making a trade-off based on the specific needs of the SAR application. The depth to which microwaves penetrate forests varies depending on the frequency. Here are some of the differences in radar bands in forested areas.

P-Band: Exploring the Forest Canopy
P-band waves have a special talent: they can pierce through the thick tree cover, making them perfect for bouncing off larger parts of the forest. Because they scatter so well within the canopy, they’re just right for measuring how much biomass is in the forest.
Most satellites orbiting Earth today mainly use C-band, L-band, or X-band. To fill in the missing piece, the European Space Agency (ESA) plans to launch the BIOMASS mission. This special P-band sensor will collect data on forest biomass from all over the world.
The goal is to create detailed maps showing the amount of biomass and the height of the forest, with a resolution as fine as 200 meters. By using the unique sensitivity of P-band SAR, the BIOMASS mission will be able to delve deep into the heart of the forest canopy.
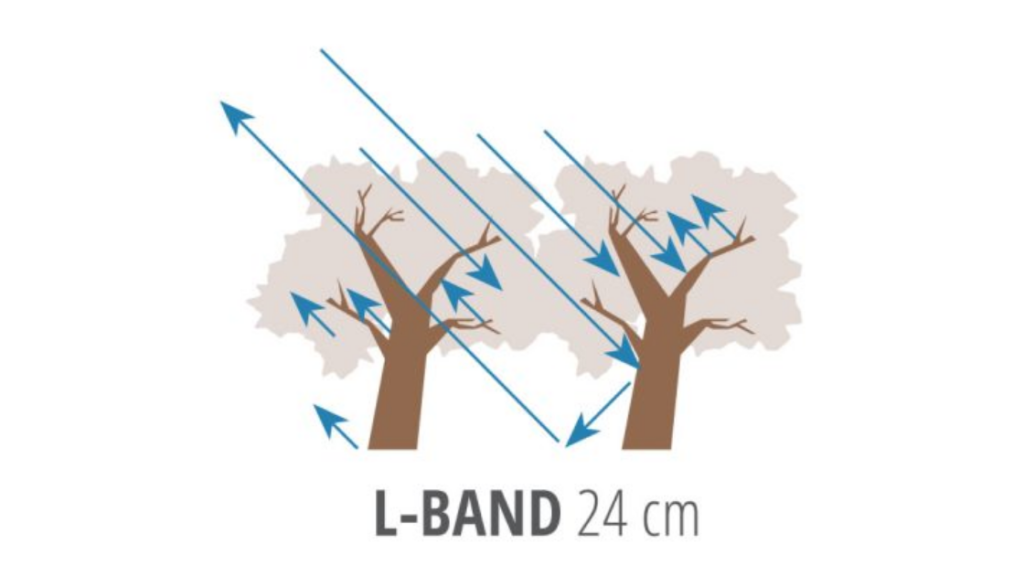
L-Band: Peering into the Forest
When it comes to forests, the backscatter from L-band radar mostly comes from the trunks and branches of trees. Just like P-band, L-band waves can dive deep into forests to measure biomass.
Some of the most common L-band sensors include Seasat, ALOS-1, and ALOS-2. These sensors have not only helped keep an eye on forests worldwide but also played a role in spotting disasters and finding natural resources.
When it comes to estimating biomass, scientists prefer using L-band and P-band sensors over higher frequencies and smaller wavelengths. This is because they have a special knack for spotting scattering from the larger parts of trees within the forest canopy.
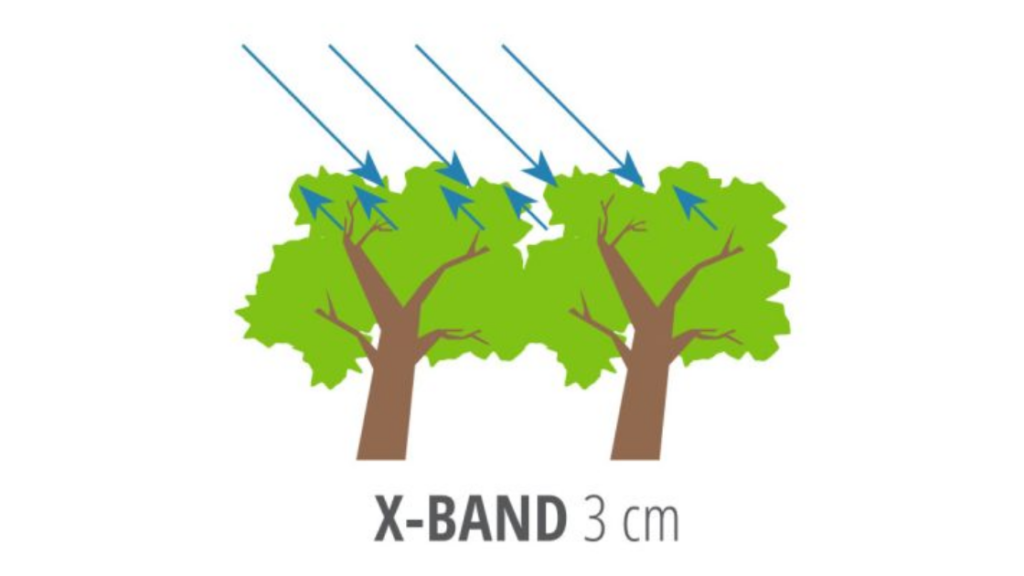
X-Band: Exploring Radar for Forestry
What do we use X-band radar for? Well, in forestry, X-band radar is pretty handy. Its frequency can bounce off the surface of the forest canopy, which means it picks up more reflections from the leaves and needles in the canopy.
One example of a sensor that works in the X-band is TerraSAR-X. It’s really good at measuring the amount of biomass in forests with fewer trees. This includes places like sparse savannas, shrublands, grasslands, or areas where crops are grown.
There are also other satellites, like COSMO-SkyMed and PAZ SAR, that have X-band instruments on board. These satellites, from Italy and Spain, can take super detailed pictures with a resolution as fine as 1 meter. They do this in Spotlight mode, and they repeat this every 11 or 16 days.
C-Band: The Hardworking Radar
C-band is like the jack-of-all-trades among radar bands. It’s actually the most common type out there. For instance, satellites like Sentinel-1, ENVISAT, and the Radarsat Constellation Mission all use C-band frequencies, which range from 7.5 to 3.8 centimeters.
In forestry, SAR C-band waves can only reach the top of the forest canopy. They mostly bounce off leaves and small branches. However, this changes if the forest is really thin, like in woodlands or savannas.
C-band radar has lots of uses. It’s great for spotting things like oil spills, checking land cover, and keeping an eye on ice and snow. Satellites like Sentinel-1 are especially good because they find a nice balance between how deep they can see, how clear the pictures are, and how well they can deal with the atmosphere.

SAR Satellites
Here’s a list of SAR satellites along with their sensor, lifetime, wavelength, and access details:
| Sensor | Lifetime | Wavelength | Access |
|---|---|---|---|
| Seasat | 1978 | L-band | Free & open |
| ERS-1 | 1991-2001 | C-band | Restricted |
| JERS-1 | 1995-1998 | L-band | Restricted |
| ERS-2 | 1995-2011 | C-band | Restricted |
| ENVISAT | 2002-2012 | C-band | Restricted |
| ALOS-1 | 2006-2011 | L-band | Free & open |
| Radarsat-1 | 1995-2013 | C-band | 1995-2008: Restricted <br> 2008-2013: Commercial |
| TerraSAR-X | 2007-2010- | X-band | Application-dependent; <br> Restricted scientific, commercial |
| Radarsat-2 | 2007- | C-band | Commercial |
| COSMO-SkyMed | 2007- | X-band | Commercial; limited proposal-based scientific |
| ALOS-2 | L-band | Commercial; limited proposal-based scientific | |
| PALSAR-2 | 2014- | L-band | Commercial; limited proposal-based scientific |
| Sentinel-1 | 2014- | C-band | Free & open |
| SAOCOM | 2018- | L-band | TBD |
| PAZ SAR | 2018- | X-band | Commercial |
| RCM | 2019 | C-band | TBD |
| NISAR | 2021 | L-band | Free & open |
| BIOMASS | 2021 | P-band | Free & open |
| TanDEM-L | 2023 | L-band | Free & open |
Where are the S-, K-, Ku-, and Ka-Bands?
These radar bands have their own uses in remote sensing, but they’re not as commonly used in synthetic aperture radar.
Example SAR Imagery

- K-band: This frequency ranges from 18 to 26.5 GHz, but it’s easily absorbed by water vapor in the atmosphere.
- Ku-band: It’s often used in altimetry, including applications in oceanography like measuring sea surface height and wave height.
- Ka-band: Airports use radar sensors in this band for monitoring systems.
- S-band: While its application in Earth observation is minimal, it’s gradually gaining attention.
Though each radar band has its strengths, they’re not widely adopted in SAR applications just yet.